
Evil Charts
by legions-developer
Beautiful animated chart components for React and Next.js, built on shadcn/ui and Recharts with bar, line, area, pie, radar, and composed chart variants.
1,381
Sep 4, 2025
open-source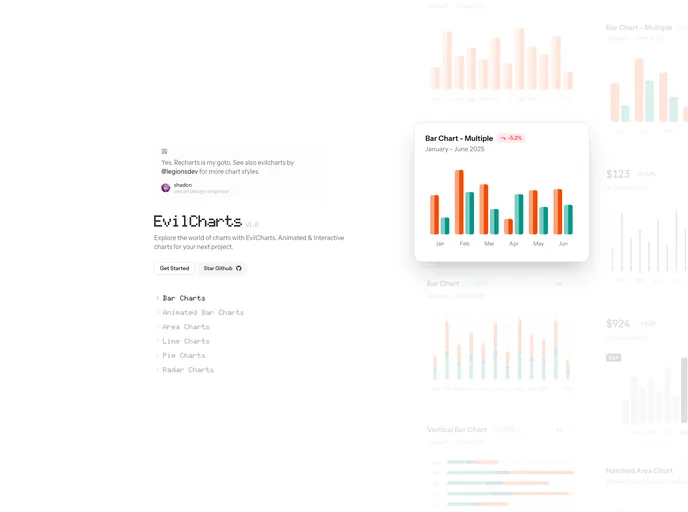
Overview
Evil Charts is a chart component library for React and Next.js built on shadcn/ui and Recharts. It provides beautifully designed, animated chart UIs — including composed charts that combine bars and lines — with copy-paste components and extensive documentation.
Features
- Built on shadcn/ui & Recharts: High-performance, familiar chart primitives with custom styling
- Animated & interactive: Engaging visualizations with brush, tooltips, legends, and click interactions
- Multiple chart types: Bar, line, area, pie, radar, composed, and more
- Customizable: Configurable colors, patterns, and effects for light and dark modes
- Copy-paste docs: Live examples and source on evilcharts.com
- Open source: MIT-licensed on GitHub