


Shadcn Charts10 listings
This collection covers charting for shadcn/ui projects, from the official Shadcn UI Charts to libraries that add animation, realtime streaming, financial chart types and AI-generated visualizations. Most use your theme's chart color variables so they follow light and dark modes.
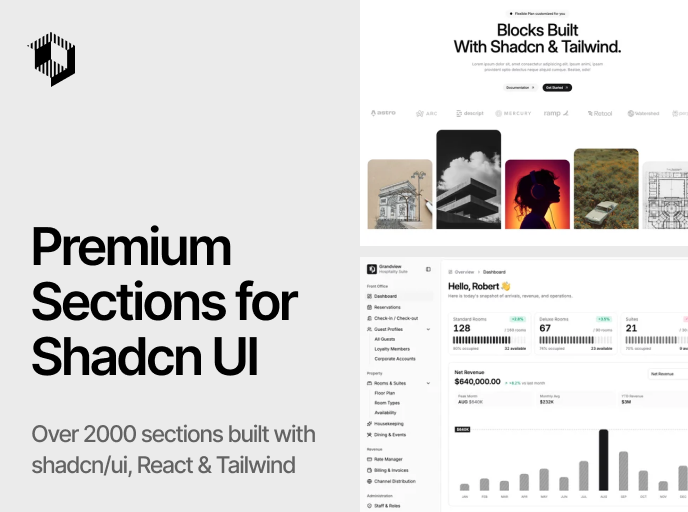

Shadcnblocks
The ultimate block set for shadcn/ui & Tailwind. 1,630 blocks, 1,684 components, and 15 templates for React, Next.js & Astro.
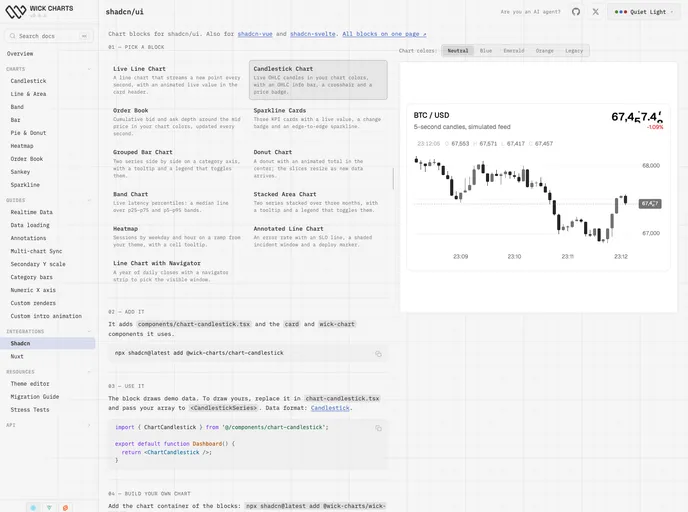

Wick Charts
Realtime canvas charts for shadcn/ui that stay smooth while data streams in. Colors come from your theme tokens, in light and dark mode.
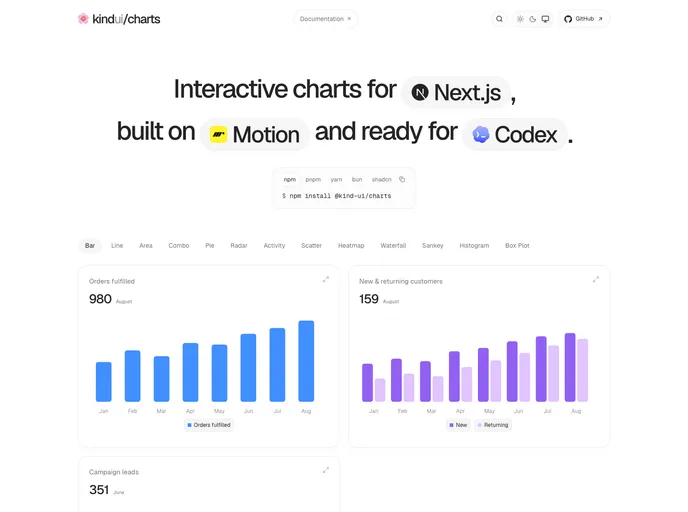

Kind UI
Editable React chart compositions backed by Kind UI Core, with explicit data, accessible interactions, and consumer-controlled animation.
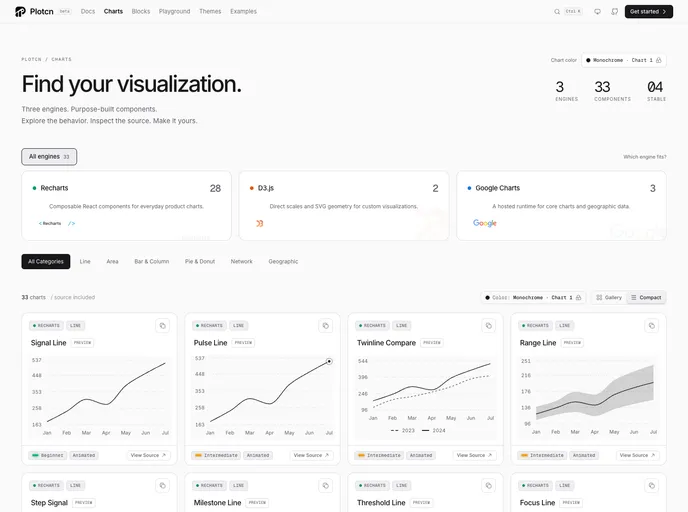

Plotcn
Source-first React visualization components for Recharts, D3.js, and Google Charts
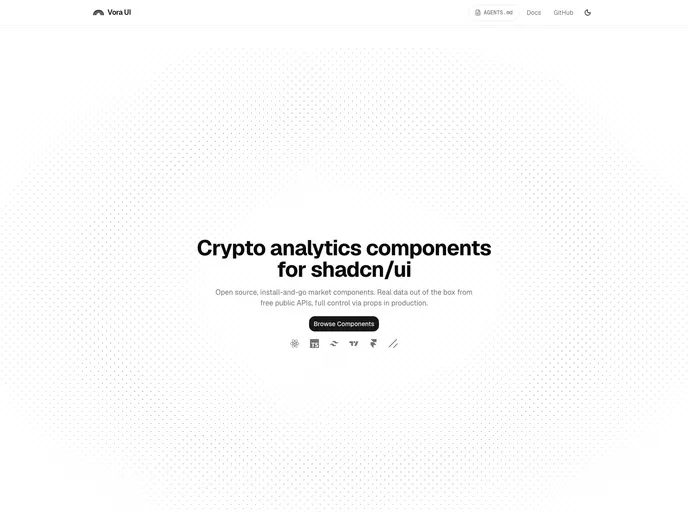

Vora UI
Open source crypto market analytics components for shadcn/ui - candlestick trading charts, BTC rainbow chart, Fear & Greed and Altseason gauges, live from free public APIs.
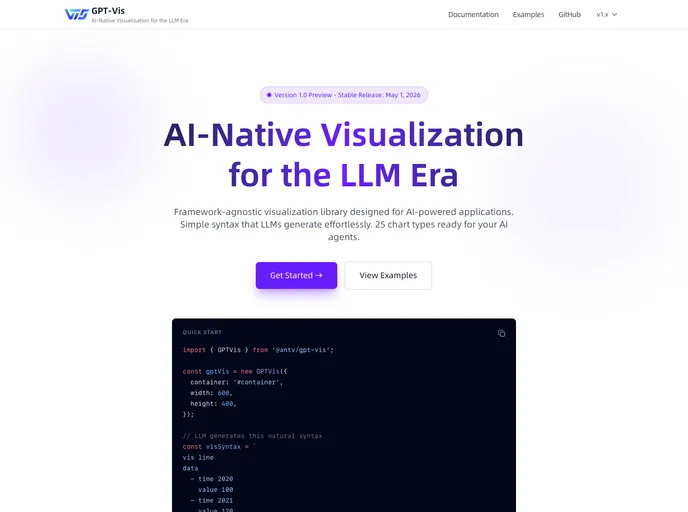

GPT-Vis
AI-native visualization components for LLM projects. Render 26 chart types from vis syntax strings or config objects.
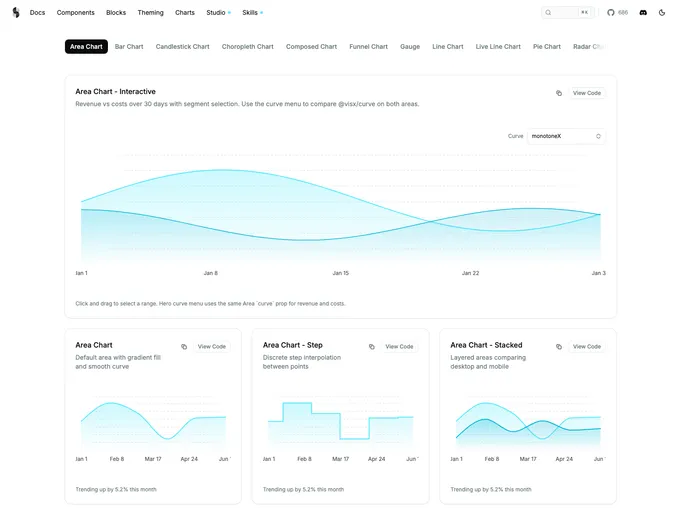

Bklit UI
Open-source charts and data visualization components for React — area, bar, line, pie, radar, sankey, candlestick, and more with shadcn-style docs.


Recharts
Composable charting library for React built on SVG and D3. The foundation behind shadcn/ui Charts, Evil Charts, and many dashboard UIs.


Shadcn UI Charts
Official shadcn/ui chart components built with Recharts. Copy-paste area, bar, line, pie, radar, radial charts, and tooltips into your apps.
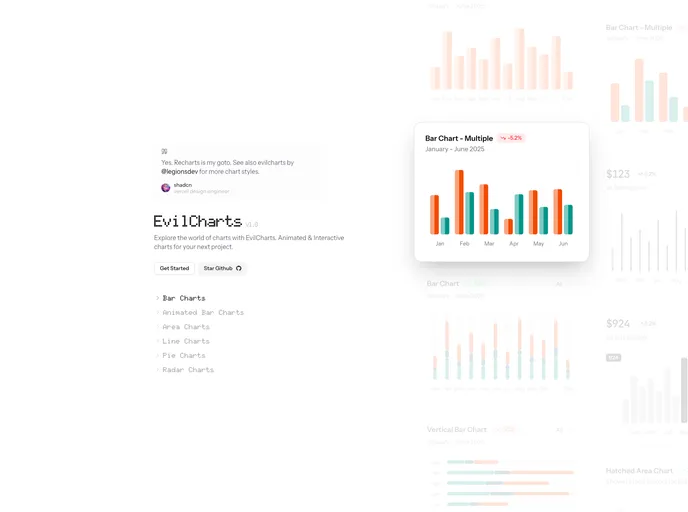

Evil Charts
Beautiful animated chart components for React and Next.js, built on shadcn/ui and Recharts with bar, line, area, pie, radar, and composed chart variants.


Tremor
Copy & Paste React components to build modern web applications.