recharts
Recharts
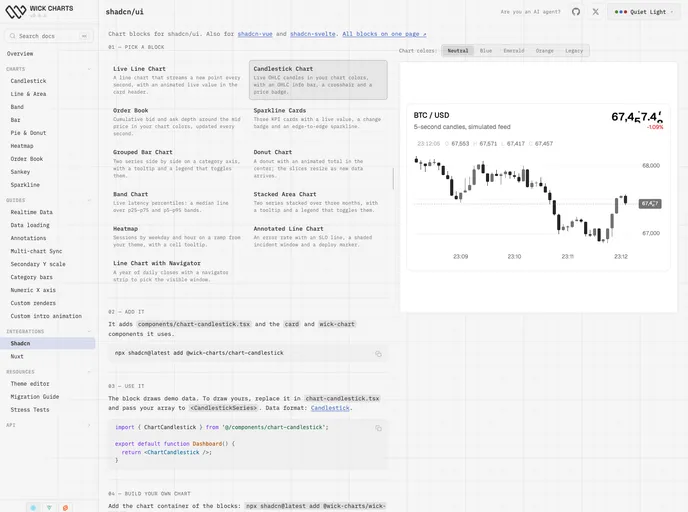
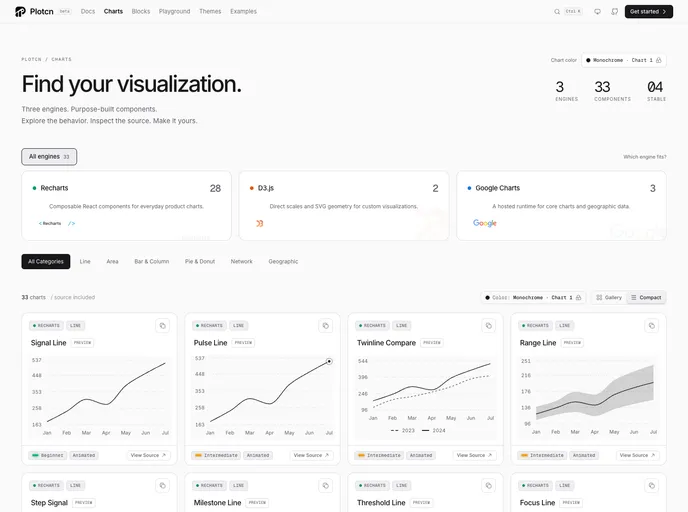
Composable charting library for React built on SVG and D3. The foundation behind shadcn/ui Charts, Evil Charts, and many dashboard UIs.
- 27.2k
- GitHub stars
- Free
- Price
- May 27, 2026
- Updated
 Open Recharts
Overview
Recharts is a composable charting library built with React and D3, maintained by the Recharts Group under the MIT license and currently at version 3.x. Charts are assembled from clearly separated React components: a LineChart, for example, is composed of independent axis, tooltip, grid and line components, each configurable through props.
Rendering uses native SVG with a lightweight dependency on D3 submodules. Recharts is widely used in the React ecosystem, including as the chart layer behind shadcn/ui's chart components, and the project provides an API reference, examples, a Storybook, a wiki and a 3.0 migration guide.
Features
- Composable: Build charts from decoupled, reusable components such as LineChart, BarChart, AreaChart and PieChart.
- Declarative: Describe charts in JSX with axes, grids, tooltips and legends as child components.
- SVG rendering: Native SVG output with minimal dependencies on D3 submodules.
- Customizable: Adjust behavior through component props or pass in custom components.
- Animations: Autoplay animations by default, with manual control available.
- Devtools: A
@recharts/devtoolspackage and a hook inspector for debugging charts. - Multiple installs: npm, Deno or a UMD build from unpkg.
Tech stack
- React, D3 submodules, SVG, TypeScript
Getting started
npm install recharts react-is