 wick-charts
Wick Charts
Realtime canvas charts for shadcn/ui that stay smooth while data streams in. Colors come from your theme tokens, in light and dark mode.
- Free
- Price
- Oct 22, 2026
- Listed
 Open Wick Charts
Overview
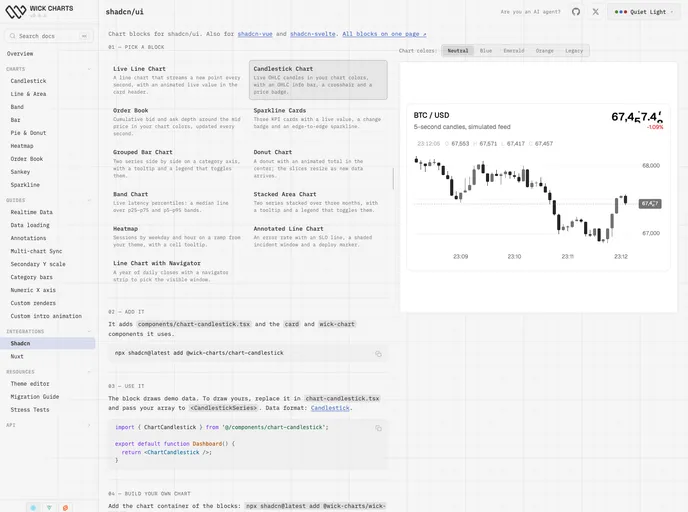
Wick Charts is a realtime canvas charting library, and its shadcn/ui integration adds a theme hook that reads a project's CSS variables, a WickChart container and ready-made chart blocks. Charts stay smooth while data streams in, and colors follow the shadcn theme in both light and dark mode. The same blocks are also offered for shadcn-vue and shadcn-svelte.
The registry has 13 items: the theme hook, the chart container and 11 blocks. Each block draws demo data that can be swapped for a real array, and custom charts are composed from series, axes and tooltips imported from @wick-charts/react.
Features
- Live line chart: Streams a new point every second with an animated live value in the card header.
- Candlestick chart: Live OHLC candles with an info bar, crosshair and price badge.
- Order book: Cumulative bid and ask depth around the mid price, updated every second.
- KPI sparkline cards: Three cards with a live value, change badge and edge-to-edge sparkline.
- Bar, donut and area charts: Grouped bars, an animated donut total and a stacked area chart with toggleable legends.
- Band and heatmap charts: Latency percentile bands and a weekday-by-hour heatmap on a theme ramp.
- Annotations and navigator: SLO lines, incident windows, deploy markers and a navigator strip for long ranges.
- Theme-aware: The theme hook reads shadcn chart colors, with Neutral, Blue, Emerald and Orange presets.
Tech stack
- React (
@wick-charts/react), Canvas - shadcn/ui, Tailwind CSS
- Vue and Svelte variants
Registry
Install via the shadcn CLI registry:
npx shadcn@latest add @wick-charts/component-name