 kind-ui
Kind UI
Editable React chart compositions backed by Kind UI Core, with explicit data, accessible interactions, and consumer-controlled animation.
- Free
- Price
- Oct 16, 2026
- Listed
 Open Kind UI
Overview
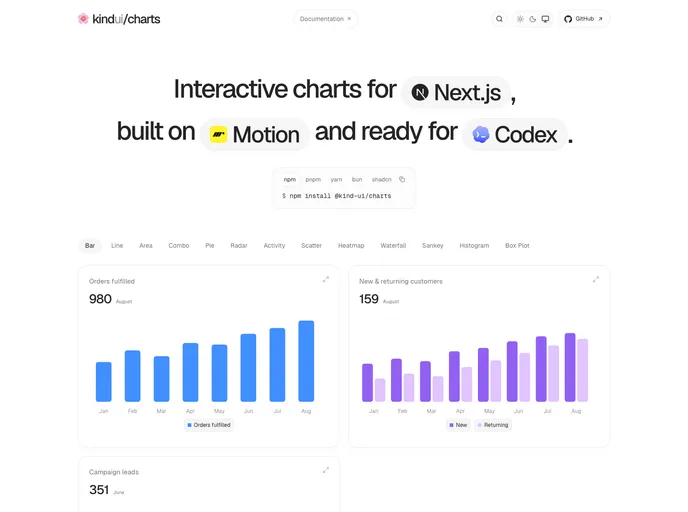
Kind UI Charts is a library of composable, interactive React chart components built on Recharts and Motion, created by Bhavesh Chowdhury. It targets React and Next.js projects and is designed to be used both by developers and by AI coding agents, with an llms.txt file and agent docs.
Charts can be installed as the @kind-ui/charts npm package or as editable compositions through the shadcn registry, which currently offers 14 chart components. Each example takes explicit data, and the docs cover identity and colors, materials, motion and accessibility. The project is MIT licensed.
Features
- 14 chart types: Area, bar, line, combo, pie, radar, radial, scatter, heatmap, histogram, box plot, waterfall, Sankey and activity rings.
- Editable compositions: Registry items copy the chart composition into the project while using Kind UI Core for behavior.
- Interactive focus: Hovering a data point can focus related series, as in the new and returning customers example.
- Explicit data: Examples document their data shape, such as caller-computed box plot distributions or balanced Sankey flows.
- Accessibility and motion guides: Dedicated docs pages cover accessible interactions and consumer-controlled animation.
- Agent-ready: Ships AI agent documentation and an
llms.txtfile.
Tech stack
- React 19, Recharts 3, Motion
@kind-ui/chartspackage
Registry
Install via the shadcn CLI registry:
npx shadcn@latest add @kind-ui/component-name