 plotcn
Plotcn
Source-first React visualization components for Recharts, D3.js, and Google Charts
- Free
- Price
- Sep 12, 2026
- Listed
 Open Plotcn
Overview
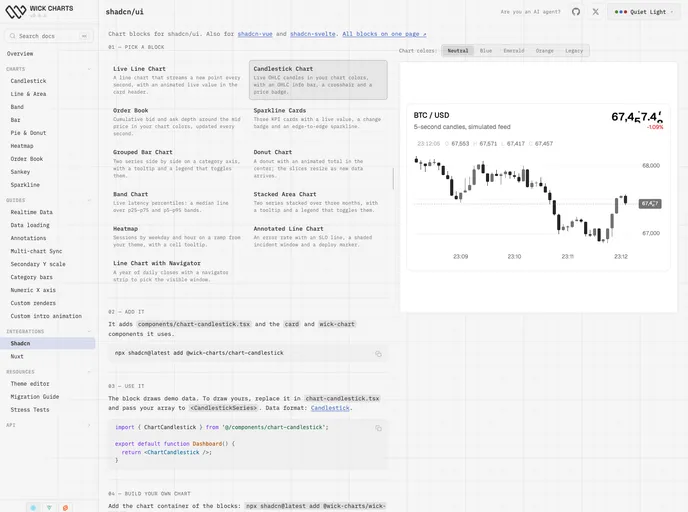
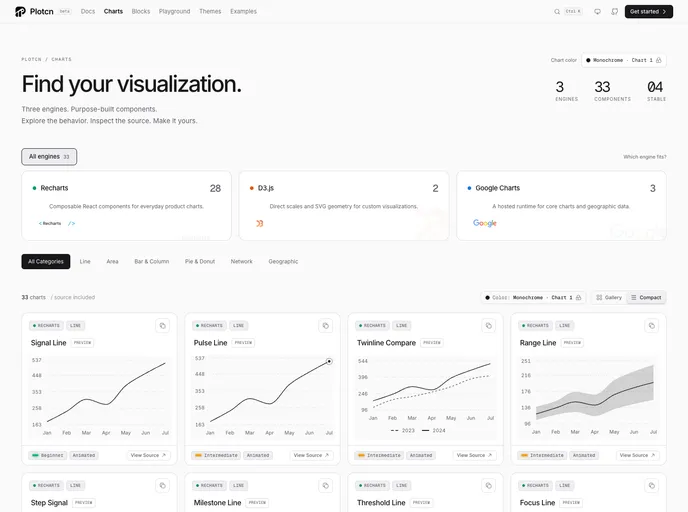
Plotcn is an open-source, source-first collection of React visualization components built on the shadcn registry, currently in beta. It combines three charting engines under one visual language: Recharts for dashboards, D3.js for bespoke geometry, and Google Charts for geographic charts and timelines. Charts install as source, so every detail can be changed in the project.
The registry includes a shared chart foundation (container, state, tooltip, legend, tokens, theme and accessibility helpers), around 30 Recharts line, area and bar variants, D3 animated line and force network charts, Google GeoChart, line and bar wrappers, and a revenue dashboard block. Charts support keyboard inspection of values and adapt from phone screens to full canvases.
Features
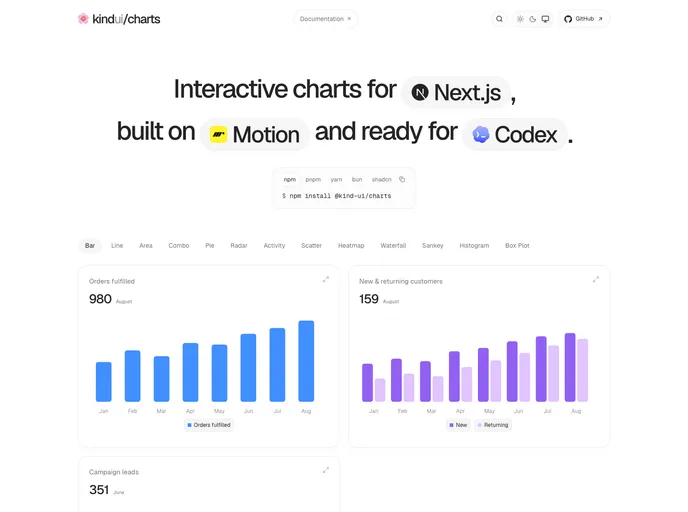
- Line charts: Signal, pulse, twin compare, range, step, milestones, threshold, focus and forecast variants.
- Area charts: Stacked flow, percent stream, range, comparison, gradient depth, baseline and interactive charts.
- Bar charts: Grouped, stacked ledger, percent stacked, diverging, bullet, variance and interval charts.
- D3 charts: An animated line and a force-directed network built on d3-scale, d3-shape and d3-force.
- Google Charts: A world choropleth GeoChart plus line and bar charts with a shared loader.
- Accessibility: Keyboard navigation to inspect data points and attention to contrast.
- Full registry install:
pnpm dlx shadcn@latest registry add @plotcnregisters the whole collection.
Tech stack
- React, Tailwind CSS, shadcn registry
- Recharts, D3.js, Google Charts, Hugeicons
Registry
Install via the shadcn CLI registry:
npx shadcn@latest add @plotcn/component-name