





Bklit UI
by bklit
Open-source charts and data visualization components for React — area, bar, line, pie, radar, sankey, candlestick, and more with shadcn-style docs.
681
May 27, 2026
open-source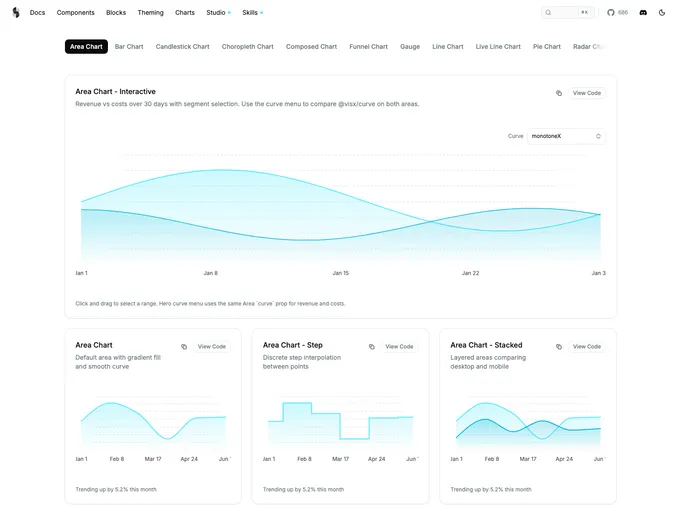
Overview
Bklit UI is an open-source charts and data visualization library for React, with documentation and copy-paste examples for dashboards and analytics UIs. Explore chart variants on the docs site (e.g. area charts), then integrate components into your app.
Features
- Rich chart types: Area, bar, line, pie, radar, ring, scatter, sankey, funnel, gauge, candlestick, choropleth, composed, and live charts
- Interactive examples: Segment selection, curve options, stacked areas, gradients, patterns, and dashed projections
- Chart utilities: Legend, grid, tooltip, axes, custom indicators, and
useCharthook - Studio & theming: Theming tools and Bklit Studio for design workflows
- shadcn-aligned docs: Component docs, blocks, and skills for AI-assisted development
- Open source: MIT-licensed on GitHub